What can
be expected to see when monitoring the weight of my hive?
When
monitoring the weight of your beehive it will yield many results and insight to
the state of your honeybee colony and help you care for your hive. These are
some typical weight characteristics you may encounter.
One of the
topics is nectar flow which is the time of year when the native vegetation is
in full bloom. This usually occurs during the fall, where there is smaller
bloom of asters, goldenrod, and other wildflowers. In very dry years, the fall
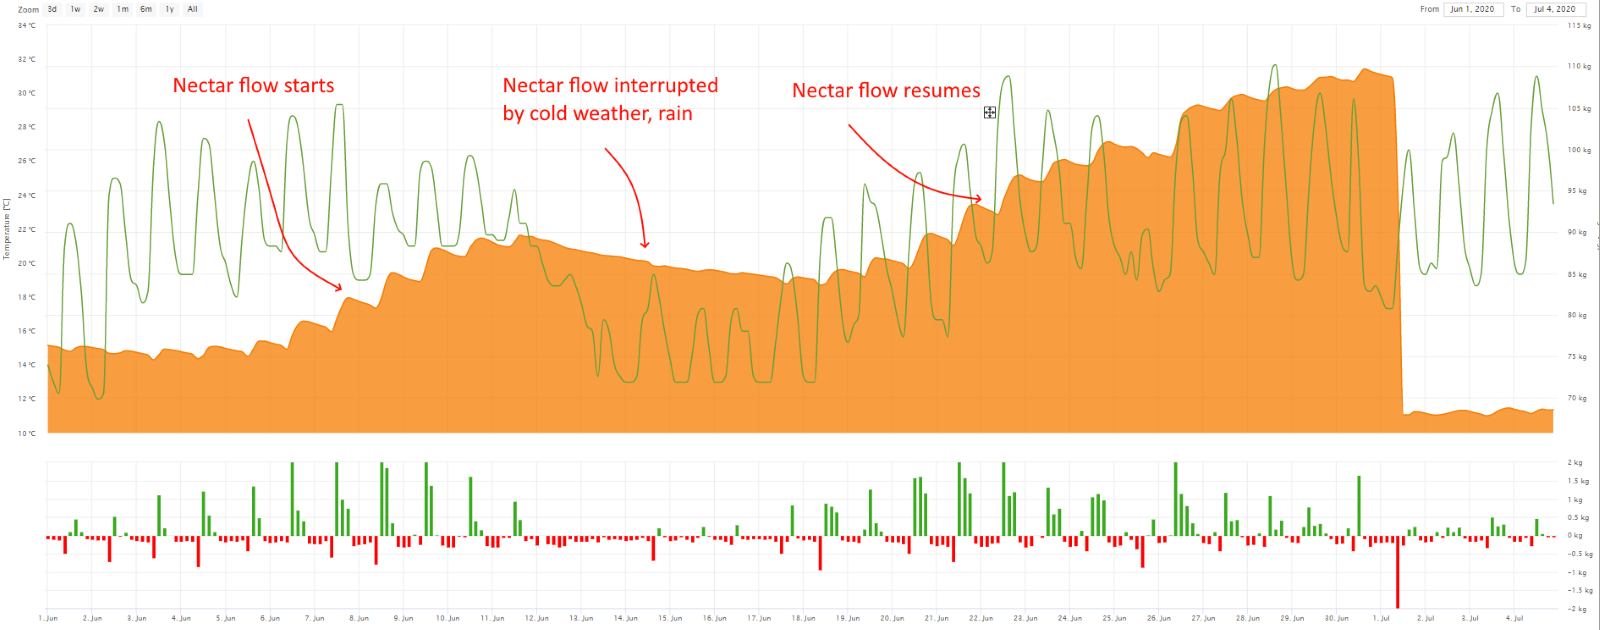
bloom can be very minimal. With SolutionBee you
can graphically view a nectar flow which is one of the most exciting things
about monitoring the weight of your beehive. With a strong nectar flow you will
want to keep checking your hive weight regularly, possibly even several times a
day. In the chart shown below it describes the data from mid-July to mid-August.
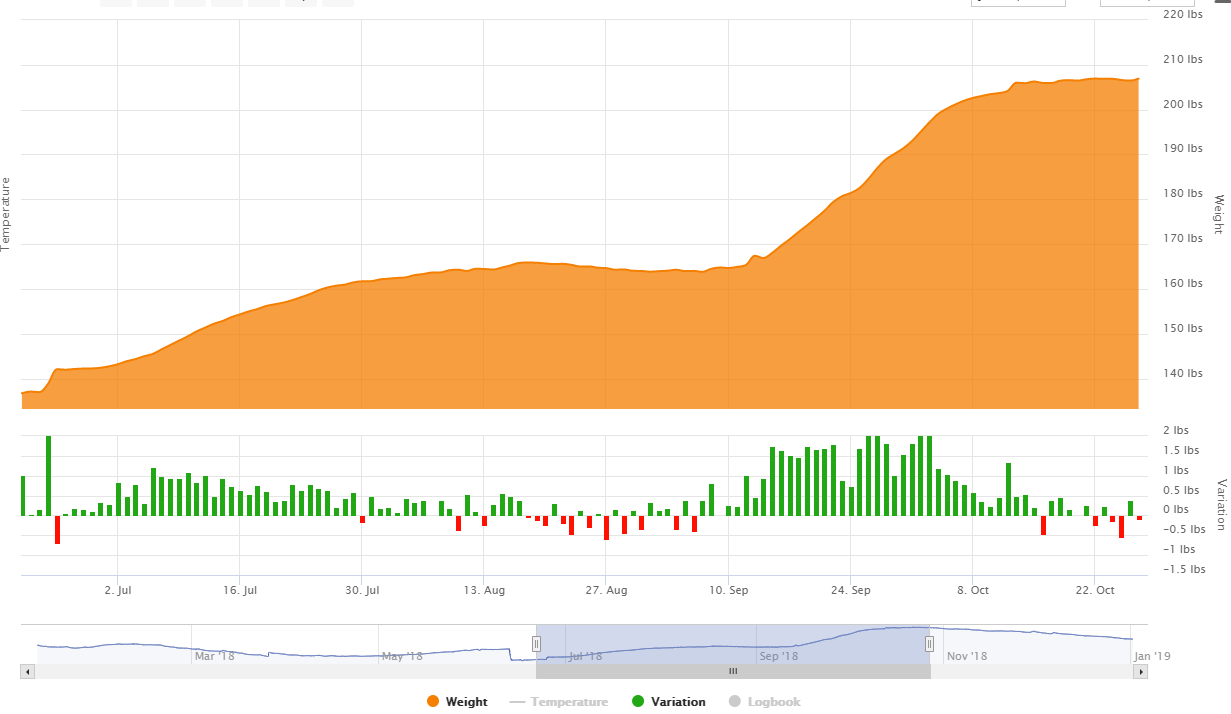
From the
graph, it is observed that the weight curve is not continuous, even with strong
nectar flow. Moreover, when zooming in closer you can see the distinct daily
ripples.
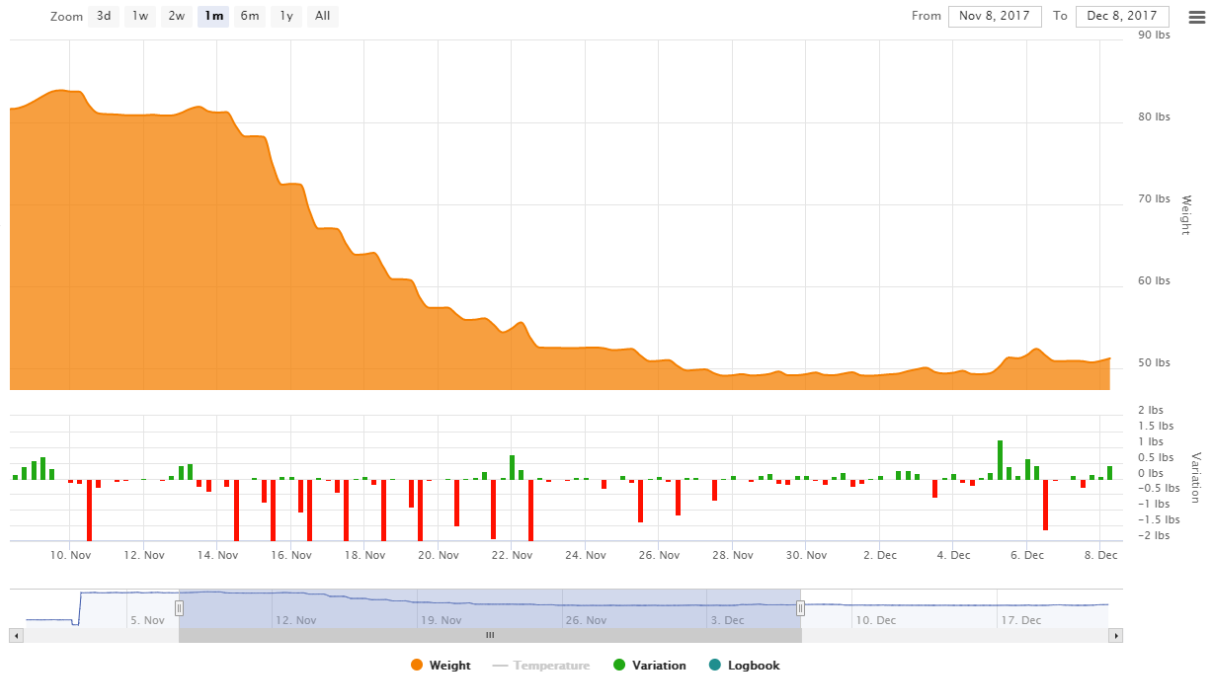
In addition,
the post nectar flow can be observed which allows beekeepers
to know when exactly the nectar flow ends. This allows them to maximize their
honey economics. Otherwise, the bees start consuming the honey right away. The
graph below shows the post nectar flow if the beekeeper does not intervene.
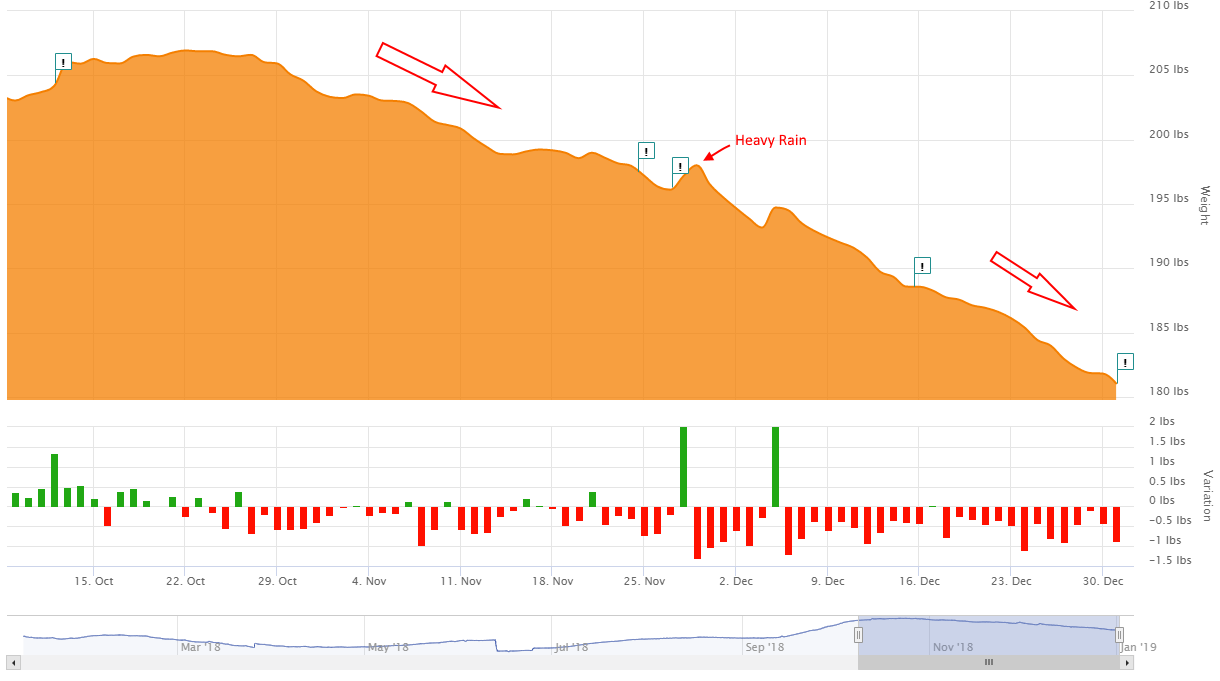
A hive can
lose between 5 and 10 lbs of
honey in a week due to bee consumption.
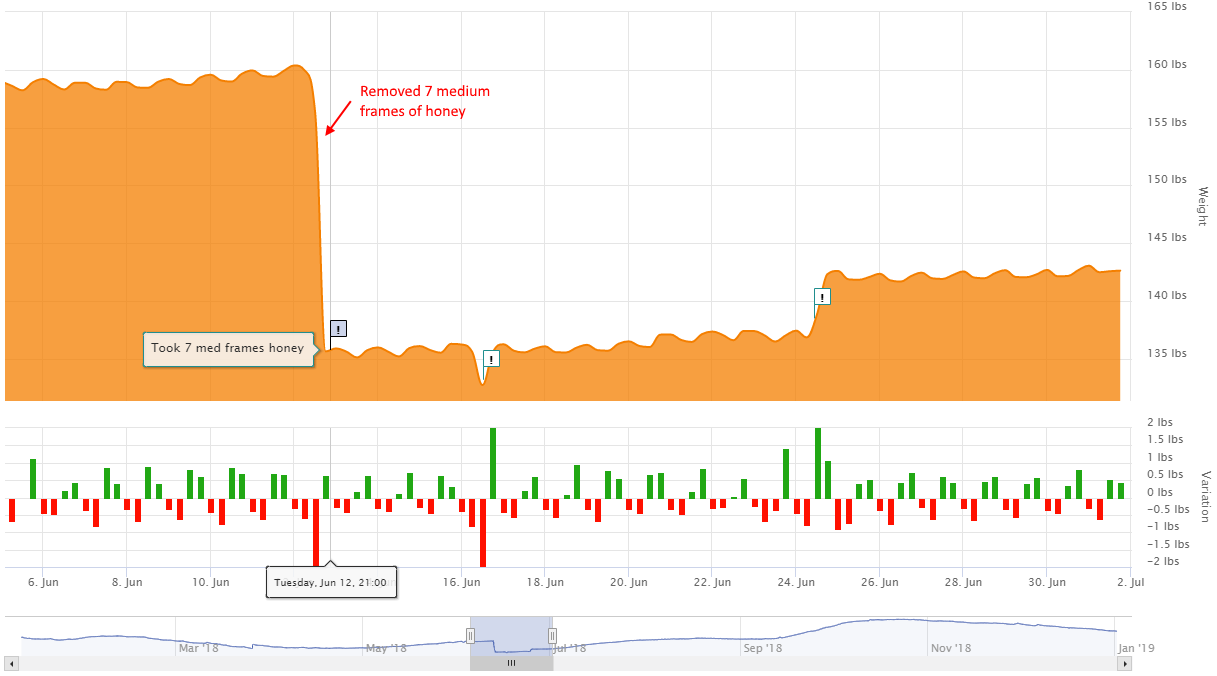
Moreover,
after harvesting honey it can be reflected by a sharp drop in weight, as would
be expected. The graph below depicts the sudden change in weight after
collecting the honey.
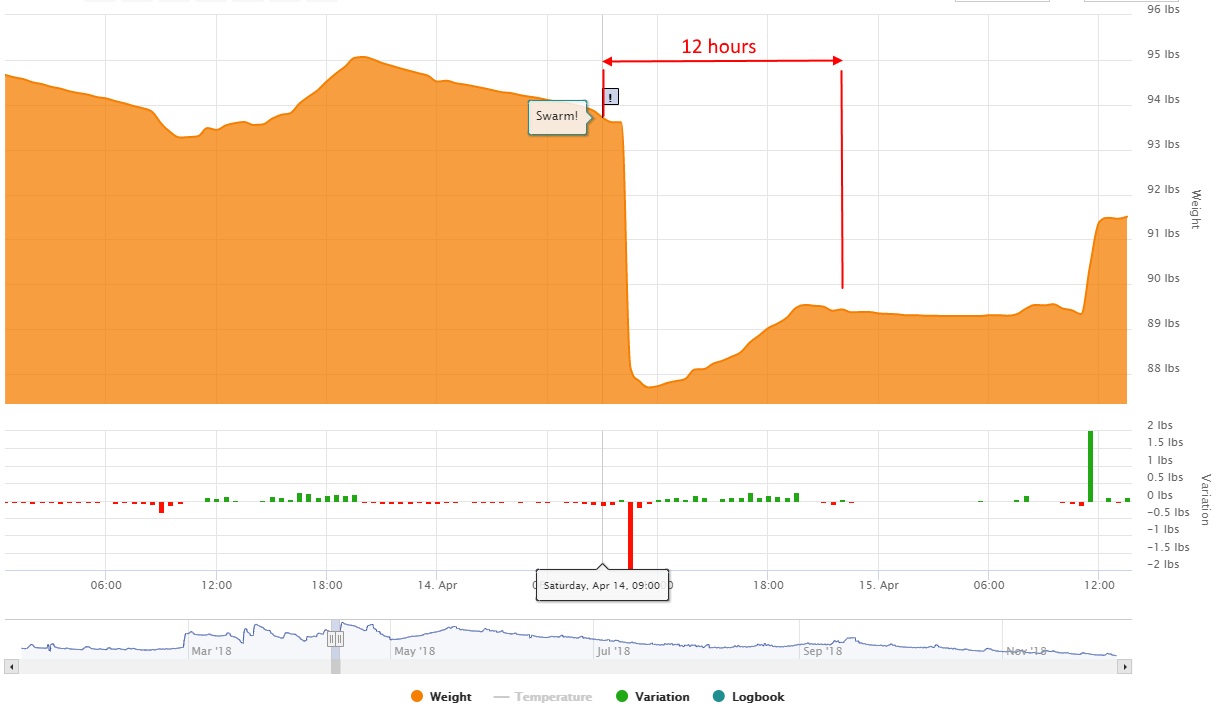
Another
great benefit of weighing the bees is that the beekeeper can determine if
swarming is occurring based on the sudden change observed in the graph.
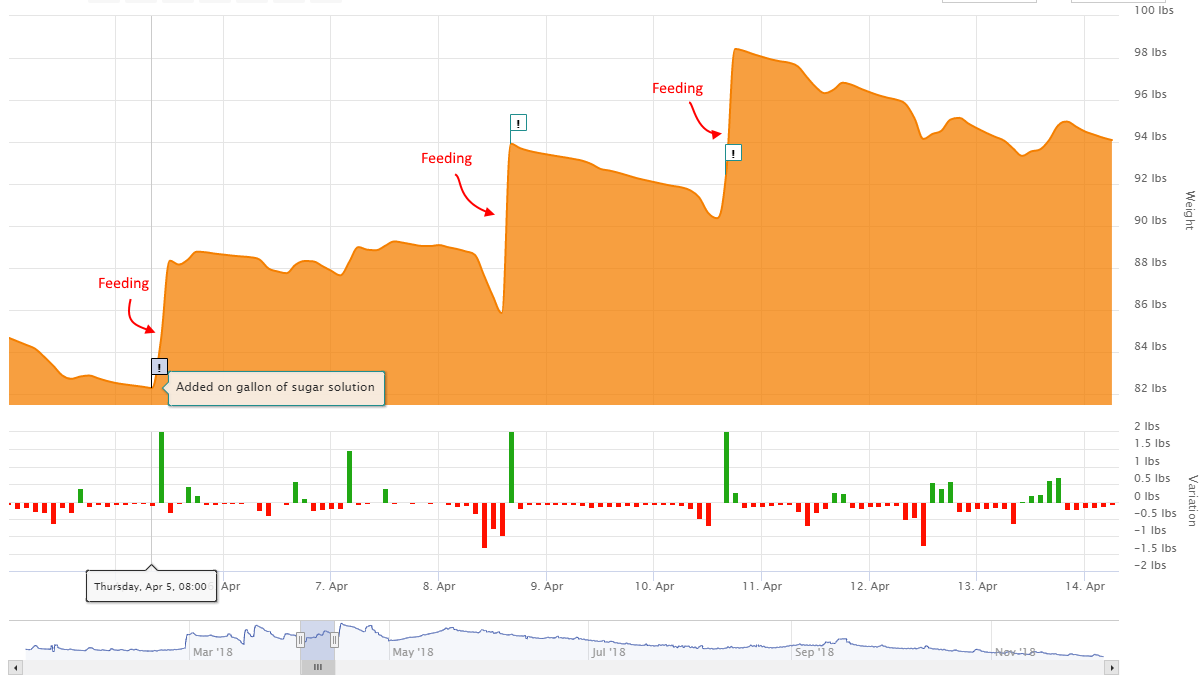
Keeping
track of the weight also helps maintain the bee’s nutrition. Making sure a
honeybee colony has enough food is a major concern for beekeepers and a main
reason why bee colonies die. In order to prevent that,
the beekeeper must assure that bees have sufficient protein and energy to
survive through times where nectar and pollen is not available. Monitoring the
weight and feeding when stores are low can prevent starvation. The graph below
shows what happens when feeding one gallon of sugar solution and how it effects
the graph.
Another
factor that the graph shows is how weather can affect the weight of a hive. It
helps to recognize the effects so that they are not mistaken for bee related
weight changes. Fortunately, they are relatively easy to recognize. Rain shows
up as a temporary weight gain and a subdued temperature curve will confirm that
the weight gain/loss is due to rain. The graphs show how the effects of rainy
days on the weight of the beehive.
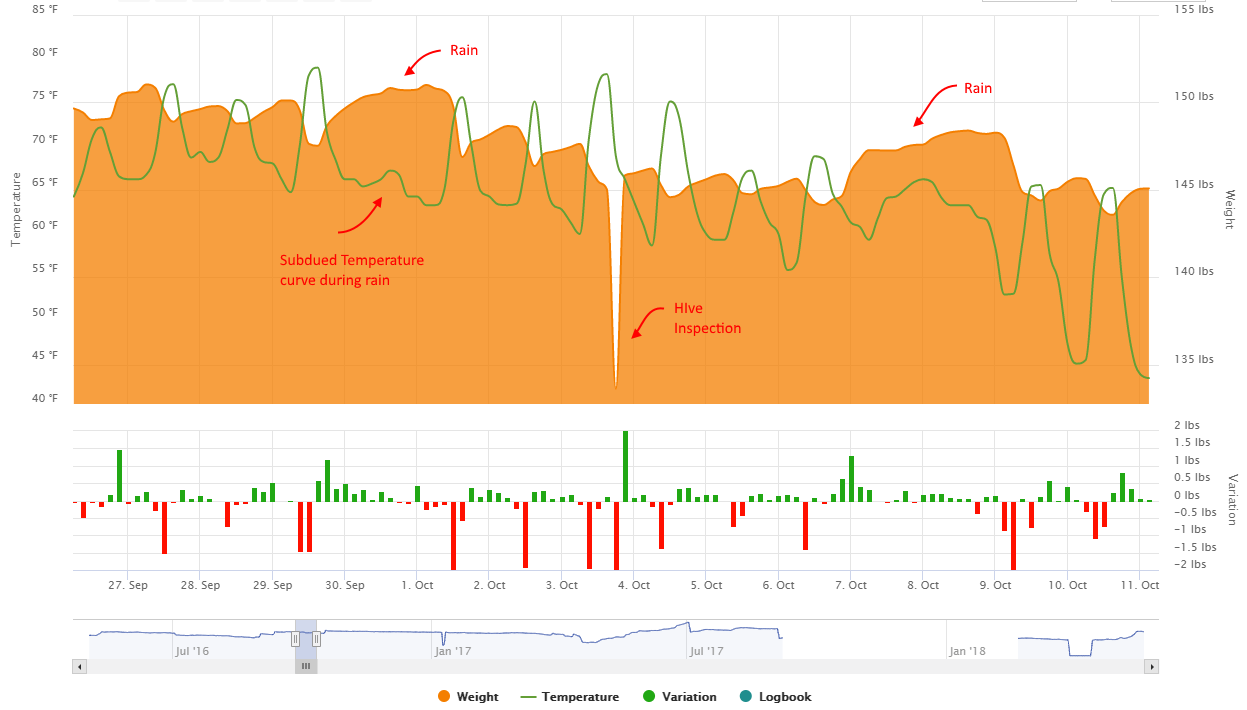
Using the
weight scale will assist in hive inspections. They often show up in the weight
graphs as the inspection involves temporarily removing hive bodies and frames.
Very sharp dips in the weight are clear signs of hive inspections shown in the
graph below.
The final
thing that weighing your beehive can help you in is with determining when the
beehive was robbed. The graph below depicts a beehive being robbed of their
honey.
In
conclusion, keeping track of the weight of a beehive can help a beekeeper
maintain a colony for a longer time. Allowing the production of honey to
increase significantly. Moreover, weighing and learning about what each graph
can represent will assist new beekeepers to maintain a hive.